SmokePing: Track Your Network Latency
Track Your Network Latency. Display Nice Graphs. Get Downtime Alerts.

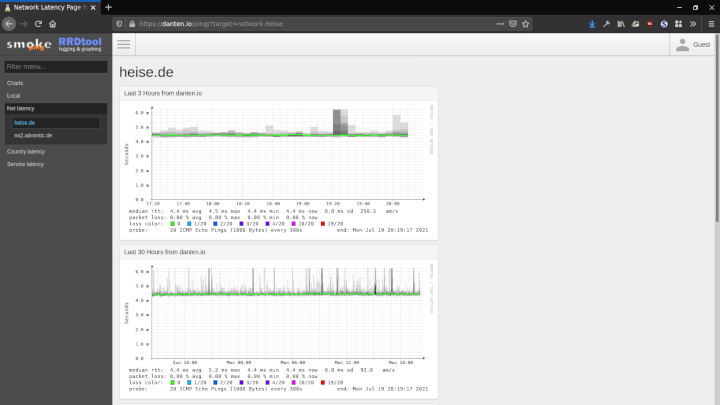
Let me introduce you to SmokePing, a nice little tool to keep track of your network latency which comes with a responsive web-based UI as well as an alert system.
SmokePing Network Latency Tracker
SmokePing helps you to probe a list of servers, store the corresponding data using RRDtool, and generate some nice statistical charts based on the output.
SmokePing consists of two parts:
You’ll have the SmokePing daemon that runs in the background and is pinging and collecting data at your set intervals, as well as the SmokePing front-end interface that then displays the collected data in the form of nice looking graphs.
The SmokePings alert system is really useful, and can be configured to send alerts via email when defined latency thresholds are reached.
Here are some of SmokePings core features:
- Best of breed latency visualisation.
- Interactive graph explorer.
- Wide range of latency measurement plugins.
- Master/Slave System for distributed measurement.
- Highly configurable alerting system.
- Live Latency Charts with the most ‘interesting’ graphs.
- Free and OpenSource Software written in Perl by the creator of MRTG and RRDtool.
– SmokePing
Install SmokePing - The Debian Way
As usual, here comes the easy part:
$ apt install apache2 curl echoping fping hping3 htop ipcalc jq lftp lynx mlocate mtr nmap pwgen rsync sipcalc smokeping tmate tree tshark unzip vnstat wget zip
You’ll note that we’re pulling some additional packages, chances are that you’ve got some of these already installed. So let’s pull ‘em in so we can proceed with the configuration.
SmokePing Configuration on Debian 10 Buster
You’ll need a running Apache with mod_fcgi - or alternatively Nginx with fcgiwrap - and SmokePing’s gonna set up its config in /etc/apache2/conf-enabled/smokeping.conf - here’s how mine looks like:
|
|
Because I prefer to install SmokePing into a subfolder called ping, as you can see from the Aliases above, I’ll need to adjust the pathnames accordingly in /etc/smokeping/config.d/pathnames:
sendmail = /usr/sbin/sendmail
imgcache = /var/cache/smokeping/images
imgurl   = ../ping/images
datadir  = /var/lib/smokeping
piddir  = /var/run/smokeping
smokemail = /etc/smokeping/smokemail
tmail = /etc/smokeping/tmail
dyndir = /var/lib/smokeping/__cgi
General SmokePing Configuration
Now let’s move on to the main Configuration in /etc/smokeping/config.d/General:
*** General ***

owner    = Daniel Tenningås
contact  = danten@localhost
mailhost = localhost
# NOTE: do not put the Image Cache below cgi-bin
# since all files under cgi-bin will be executed ... this is not
# good for images.
cgiurl   = http://some.url/smokeping.cgi
# specify this to get syslog logging
syslogfacility = local0
# each probe is now run in its own process
# disable this to revert to the old behaviour
# concurrentprobes = no

@include /etc/smokeping/config.d/pathnames
Defining Your Probes - Your Methods of Probing
Then we’ll specify how we want to conduct our probes in /etc/smokeping/config.d/Probes:
*** Probes ***
 + FPing
 binary = /usr/bin/fping
 packetsize = 1000

 + DNS
 binary = /usr/bin/dig
 lookup = heise.de
 pings = 5
 step = 180
Other methods of probing are also possible, such as SSH, EchoPing & cURL. Let’s stick with a simple FPing and a dig to probe DNS latency for time being.
Targets - The Machines You Probe
Now comes the fun part where we can play around a lot, we get to specify our targets in /etc/smokeping/config.d/Targets - here’s how that looks like on my box:
*** Targets ***

probe = FPing

menu = Top
title = Network Latency Grapher
remark = Welcome to the Network Latency Grapher aka my SmokePing implementation. \
         Here you can learn more about the latency of the danten.io network.

+ Local

menu = Local
title = Local Network

++ LocalMachine

menu = Local Machine
title = This host
host = localhost
#alerts = someloss

+ network
 menu = Net latency
 title = Network latency (ICMP pings)

 ++ Heise
 host = heise.de
 ++ Advantic
 host = ns2.advantic.de

+ countries
  menu = Country latency
  title = Country latency, ICMP Pings
++ Europe
menu = Europe
title =European Connectivity

+++ Germany

menu = Germany
title = German Connectivity
#alerts = bigloss,someloss,startloss

++++ Heise

menu = Heise
title = Heise
host = www.heise.de

+++ Norway

menu = Norway
title = Norway latency

++++ NTNU

menu = NTNU
title = NTNU
host = www.ntnu.no

++++ NRK

menu = NRK
title = NRK
host = www.nrk.no

+++ UK

menu = UK
title = BBC
host = www.bbc.co.uk

+++ Switzerland

menu = Switzerland
title = CERN
host = cern.ch

++ USA

menu = North America
title =North American Connectivity

+++ MIT

menu = MIT
title = Massachusetts Institute of Technology Webserver
host = web.mit.edu

 + services
 menu = Service latency
 title = Service latency (DNS, HTTP)

 ++ DNS
 probe = DNS
 menu = DNS latency
 title = Service latency (DNS)

 +++ dns1
 host = ns2.advantic.de

 +++ dns2
 host = 8.8.8.8

 ++ HTTP
 menu = HTTP latency
 title = Service latency (HTTP)

 +++ www1
 host = www.heise.de

 +++ www2
 host = danten.io

 +++ www3
 host = www.nrk.no
SmokePing Configuration Syntax
Each + character defines a section in the SmokePing hierarchy. Spaces are not allowed in the section names, and it’d be better to avoid period and forward slashes in these section names, as it seems the RRD files are stored under the data directory with the same exact names as the sections.
SmokePing is a powerful tool with many advanced configuration options. You can setup many different types of probes. You can setup a SmokePing chain of servers that can send their statistics and show you probes from other machines. You can also create your own custom probes in Perl.
Above configuration is only scratching at the surface of the many options SmokePing hides underneath its hood, but should be OK to get up running.
Visit my SmokePing to check out how that looks.
:wq